
[Photo by Guillaume Bolduc on Unsplash]
Tables in a journal article can present a large amount of data and often in less space than words. Tables can also clarify relationships between groups. An article that attempts to explain the same results in narrative form or that presents the same amount of data in the text could be asking a reader to work much harder to pick out relevant findings.
In which form can you more easily contrast the age of the 2 study groups in this example?
In the text: “The control group had a mean body weight of 66 kg, a mean age of 52 years, a mean height of 160 cm, and a mean BMI of 25, whereas the experimental group had a mean body weight of 70 kg, a mean age of 55 years, a mean height of 160 cm, and a mean BMI of 27.”
Or as a table:
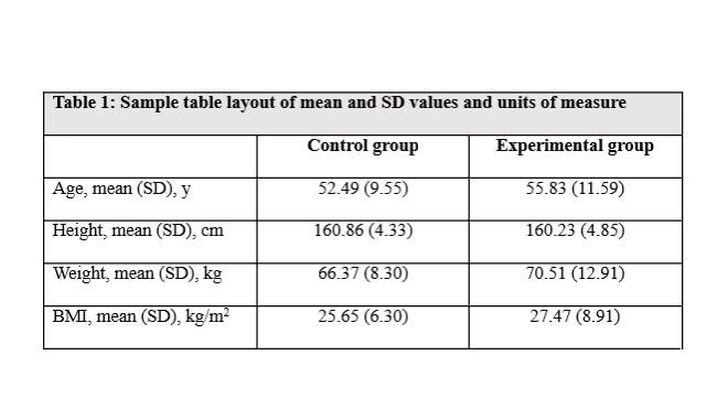
The table presents additional statistics (SD) as well.
Following are some tips for creating and editing tables that I have collected from the information for authors of various journals, from presentations given at the American Medical Writers Association conference, from the AMA Manual of Style, and from my experience as a former manuscript editor for a biomedical journal.
Create a Table
Use Word's Insert Table function or the corresponding table editor of your word processing software to create tables.
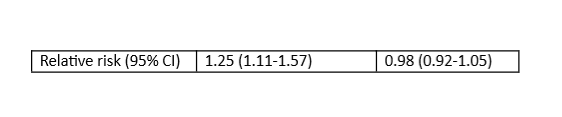
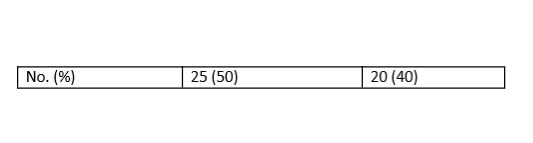
Place each value in its own cell. Do not just tap away on the space bar or insert tabs to space out your values so that they look pretty on the page. You can, however, keep the 95% CI in the same cell as the corresponding statistic and can keep percentages in the same cell as the n; treat these values as a unit:
Also, each row of data needs to be in a separate row of cells. Table 2 illustrates what not to do when you have subgroups in a column.
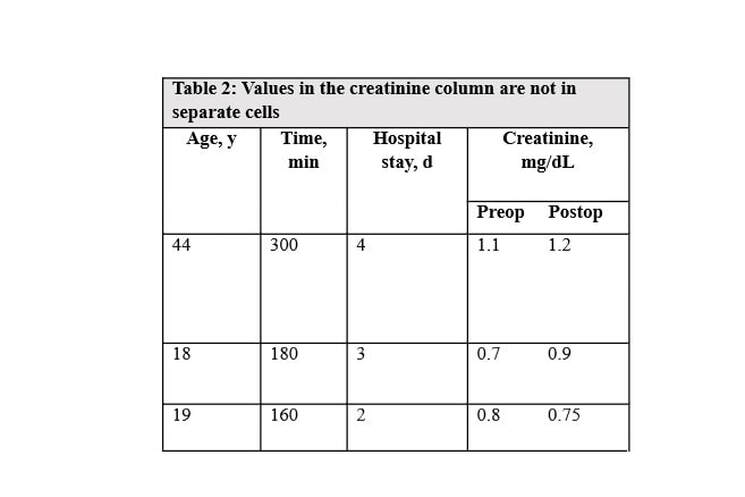
If you create a table like Table 2 using spaces or tabs to align your data (like the values in the creatinine column), the software used to covert what you submit to the journal may or may not capture all those spaces and tabs you laboriously inserted. The page proofs you receive may look like Table 3 instead:
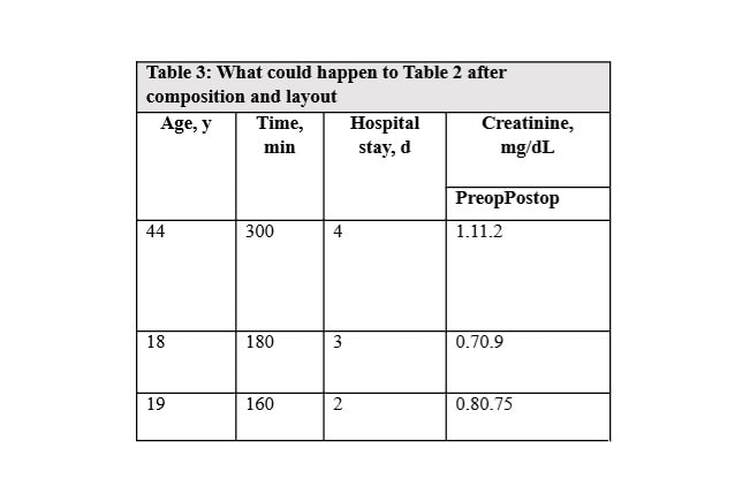
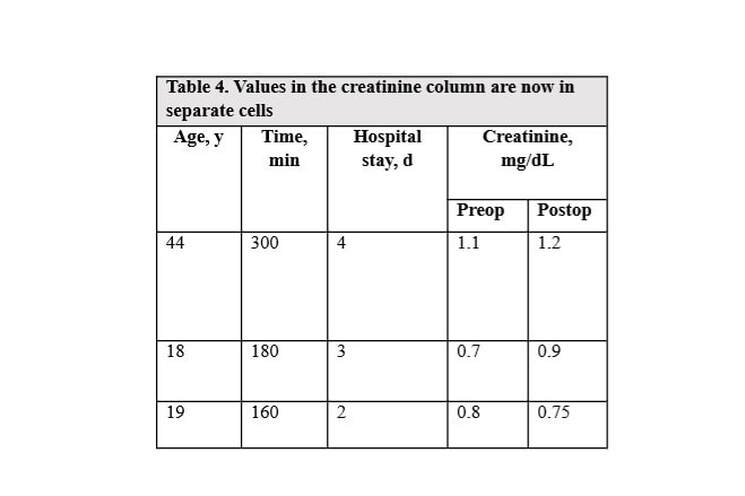
You will want to split the cells in the last column. The corrected table will look like Table 4.
Consider Table Layout
Tables are ordered in rows and columns. Keep in mind how we read text in English (left to right and top to bottom) when considering the organization of a table. Some sources suggest that it is easier to compare values in columns and to therefore put the most important comparisons in columns. Other sources say the primary comparisons should be shown horizontally. The Publication Manual of the American Psychological Association (6th ed) perhaps sums it up best: put values that are meant to be compared next to each other.
Add Units of Measure
I add queries about missing units of measure to tables far more often than you might expect. The variable in a row or column heading should be followed by a unit of measure. Add “unit of measure?” to your final table checklist.

Editing Tips
|